This is another example of a web form with an animated line chart with animations, designed using HTML, CSS, JavaScript and Bootstrap framework 4. JavaScript functions have been used to implement the refresh button. The fonts and icons are imported to the code with their URLs. The colors are predefined as variables which are $green:#50E3C2, $blue:#21A6EE, $purple:#807CCC, $navy:#384051, $dot-color:fade-out(white,0.9), and $text-color:fade out(white, 0.7). The body is given the styles of background as $navy, color as $text-color, and font-family as "Montserrat", sans-serif. The credits section has the styles of width as 560px, margin as 9em auto 3em auto, text-align as center, and font-size as 0.75em. The chart is given a linear gradient color of (center center, $dot-color, $dot-color 2px, transparent 2px, transparent 100%), a width of 560px, height of 260px, and a background-size of 29px 29px. Datasets 1, 2, and 3 are given background colors of $green, $blue, and $purple, respectively. The refresh button is given a background as fade-out(white, 0.5), border-radius as 5px, color as $navy, padding as 0.25em 1em, font-size as 1em, and cursor style as pointer to get the hand cursor effect.
Source: https://codepen.io/christiannaths/pen/yNBjBq
Animated Chart
4.3.1

This is another example of a web form with an animated line chart with animations, designed using HTML, CSS, JavaScript and Bootstrap framework 4. JavaScript functions have been used to implement the chart. The background color of the form is set as #252429. The body of the form is given the styles of height as 100%, display as flex, flex-direction as column, align-items as center, justify-content as center, and width as 100%. The chart is given a style set of animation as fadeIn 600ms cubic-bezier(.57,.25,.65,1) 1 forwards, opacity as 0, max-width as 640px, and width as 100%. The chart color is set as a linear gradient color by combining rgba(255, 0,0, 0.5)'), rgba(255, 0, 0, 0.25)'), and rgba(255, 0, 0, 0)') colors. Chart labels have been defined as January, February, March, April, May, and June. The background color of the points is set as white. The styles for the tooltips is set as backgroundColor as 'rgba(0,0,0,0.3)', titleFontColor as 'red', caretSize as 5, cornerRadius as 2, xPadding as 10, and yPadding as 10.
Source: https://codepen.io/grayghostvisuals/pen/gpROOz
Custom Gradient Chart
4.3.1
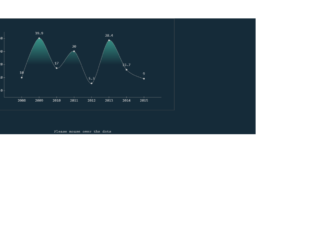
This is another example of a web form with an animated line chart with animations, designed using HTML, CSS, JavaScript and Bootstrap framework 4. JavaScript functions have been used to implement the chart. The body of the form is given a style set of overflow as hidden, background as #152B39, font-family as Courier, monospace, font-size as 14px, and color as #ccc. Chart label is given the styles of height as 1em, padding as .3em, background as rgba(255, 255, 255, .8), position as absolute, and color as #333. The width and height for the form are defined as 700 and 350, whereas the line width is set as 1. The chart color is set as a linear gradient color by combining hsla(167,72%,60%,1) and hsla(167,72%,60%,0) colors. The dataset for the X-axis is set as 2008- 2015 whereas the Y-axis is set as 0- 40.
Source: https://codepen.io/enxaneta/pen/KVGWQL
Animated Chart
4.3.1

This is an example of a web form with a responsive and animated line chart, designed using HTML, JavaScript and Bootstrap framework 4. JavaScript functions have been used to implement the chart with the Chart.js library imported to the code with its URL. Chart labels have been defined as January, February, March, April, May, June, and July. Three datasets have been defined with separate background colors as rgba(151,187,205,0.5) for dataset 1, rgba(151,187,205,0.5) for dataset 2, and rgba(220,220,220,0.5) for dataset 3. The responsive option is set as true to optimize the chart's layout for different screen sizes through the dynamic insertion and removal of columns. The chart can be randomized by clicking on the Randomize button which dynamically adds data to the datasets array. The method myBar.update() refreshes and updates the chart after dynamically changing it.
Source: https://codepen.io/chriswatts90/pen/yayoBg
Responsive Bar Chart
4.3.1
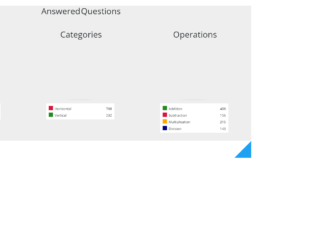
This is another example of a web form with responsive and animated pie charts, designed using HTML, CSS, JavaScript and Bootstrap framework 4. The concept of Lists has been used with UL and LI components. UL element has been used with the child elements of LI to display the details in an orderly manner. Media queries have been used to increase the responsiveness of the form. Javascript functions with createPieCharts() have been used to create and implement the pie charts. The body of the form is given a style set of font-family as "Open Sans", Arial, background as #EEE, text-align as center, and font-weight as 300. Three pie charts have been created as Micro-skills, Categories, and Operations. The chart legend section is given the styles of background as #FFF, padding as 0.75em 0.75em 0.05em, font-size as 13px, box-shadow as 1px 1px 0 #DDD, 2px 2px 0 #BBB, text-align as left, and width as 65%. The list items are given the styles of height as 1.25em, margin-bottom as 0.7em, padding-left as 0.5em, border-left as 1.25em solid black em, and font-style as normal.
Source: https://codepen.io/MaciejCaputa/pen/VjVpRZ

This is an example of a web form with appear animations, designed using HTML, CSS, and Bootstrap framework 4. The colors are pre-defined as variables which are b: #5aa8e8, b-rgba: rgba(108,90,232,0.25), b-skills: #5E95E8, and w: #fff. The transitions are defined as tr01: all .5s ease-in-out, and bezier: cubic-bezier(.17,.67,0,1). The bar values are also defined according to the percentage values. The body of the form is given a style set of background color as #5aa8e8, font-size as 100%, and font-family as sans-serif. The width for the 1st and 2nd bars is given as 90% with the 2nd bar having an animation-delay of 0.05s. The 3rd bar is given a width of 80% with an animation-delay of 0.1s. The 4th bar has a width of 70% with a delay of 0.15s. The 5th bar has a width of 75% with an animation-delay of 0.2s. The 6th bar has a width of 60% with a delay of 0.25s, whereas the 7th bar has a width of 80% with a delay of 0.3s. The 8th bar is given a width of 75% with an animation-delay of 0.35s.
Source: https://codepen.io/Chaaampy/pen/mwvpGE
Bar Graph
4.3.1